
Page 8 - annualreport2020
P. 8
AFRICAN DAWN ANNUAL REPORT 2020
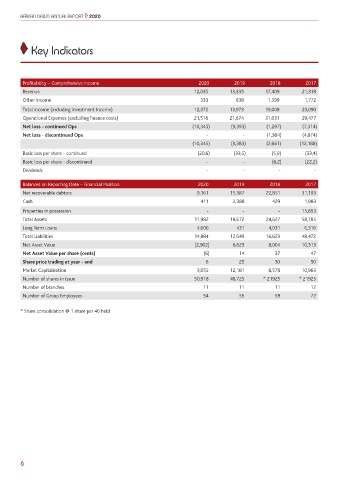
Key Indicators
Profitability – Comprehensive Income 2020 2019 2018 2017
Revenue 12,035 13,335 17,409 21,318
Other Income 333 638 1,599 1,772
Total Income (including investment Income) 12,372 13,973 19,008 23,090
Operational Expenses (excluding finance costs) 21,516 21,674 31,031 29,477
Net loss - continued Ops (10,345) (9,393) (1,297) (7,314)
Net loss - discontinued Ops - - (1,364) (4,874)
(10,345) (9,383) (2,661) (12,188)
Basic loss per share - continued (20,6) (33,5) (5,9) (33,4)
Basic loss per share - discontinued - - (6,2) (22,2)
Dividends - - - -
Balances on Reporting Date – Financial Position 2020 2019 2018 2017
Net recoverable debtors 9,161 15,387 22,851 31,193
Cash 411 2,388 429 1,983
Properties in possession - - - 15,853
Total Assets 11,982 18,672 24,627 58,785
Long Term Loans 4,600 431 4,031 6,316
Total Liabilities 14,884 12,049 16,623 48,472
Net Asset Value (2,902) 6,623 8,004 10,313
Net Asset Value per share (cents) (6) 14 37 47
Share price trading at year - end 6 25 30 50
Market Capitalisation 3,055 12,181 6,578 10,963
Number of shares in issue 50,918 48,725 * 21925 * 21925
Number of branches 11 11 11 12
Number of Group Employees 54 55 59 72
* Share consolidation @ 1 share per 40 held
6