
Page 81 - annualreport2020
P. 81
AFRICAN DAWN ANNUAL REPORT 2020
Notes to the Financial Statements continued
Annual Financial Statements For the year ended 29 February 2020
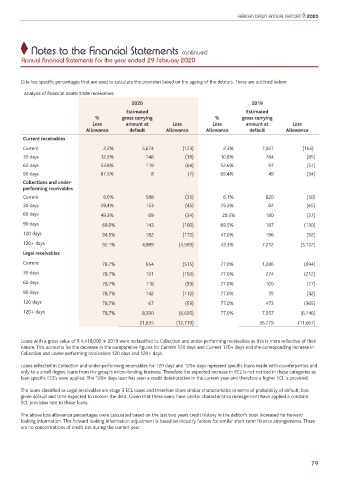
Elite has specific percentages that are used to calculate the provision based on the ageing of the debtors. These are outlined below:
Analysis of financial assets trade receivables:
2020 2019
Estimated Estimated
% gross carrying % gross carrying
Loss amount at Loss Loss amount at Loss
Allowance default Allowance Allowance default Allowance
Current receivables
Current 2.2% 5,674 (123) 2.3% 7,027 (165)
30 days 12.2% 148 (18) 10.8% 784 (85)
60 days 53.8% 119 (64) 52.6% 97 (51)
90 days 87.5% 8 (7) 69.4% 49 (34)
Collections and under-
performing receivables
Current 6.0% 588 (35) 6.1% 820 (50)
30 days 29.4% 153 (45) 79.3% 82 (65)
60 days 49.3% 69 (34) 20.5% 180 (37)
90 days 69.9% 143 (100) 69.5% 187 (130)
120 days 94.5% 182 (172) 47.0% 196 (92)
120+ days 92.1% 4,989 (4,593) 43.3% 7,212 (3,122)
Legal receivables
Current 78.7% 654 (515) 77.0% 1,286 (994)
30 days 78.7% 191 (150) 77.0% 274 (212)
60 days 78,7% 118 (93) 77.0% 100 (77)
90 days 78,7% 142 (112) 77.0% 55 (42)
120 days 78,7% 67 (53) 77.0% 473 (365)
120+ days 78,7% 8,390 (6,605) 77.0% 7,957 (6,146)
21,635 (12,719) 26,779 (11,667)
Loans with a gross value of R 4,418,000 in 2019 were reclassified to Collection and under-performing receivables as this is more reflective of their
nature. This accounts for the decrease in the comparative figures for Current 120 days and Current 120+ days and the corresponding increase in
Collection and under-performing receivables 120 days and 120+ days.
Loans reflected in Collection and under-performing receivables for 120 days and 120+ days represent specific loans made with counterparties and
only to a small degree loans from the group’s micro-lending business. Therefore the expected increase in ECL is not noticed in these categories as
loan specific ECL’s were applied. The 120+ days loan has seen a credit deterioration in the current year and therefore a higher ECL is provided.
The loans classified as Legal receivables are stage 3 ECL loans and therefore share similar characteristics in terms of probability of default, loss
given default and time expected to recover the debt. Given that these loans have similar characteristics management have applied a constant
ECL provision rate to those loans.
The above loss allowance percentages were calculated based on the last two years credit history in the debtor’s book increased for forward
looking information. This forward looking information adjustment is based on industry factors for similar short term finance arrangements. There
are no concentrations of credit risk during the current year.
79